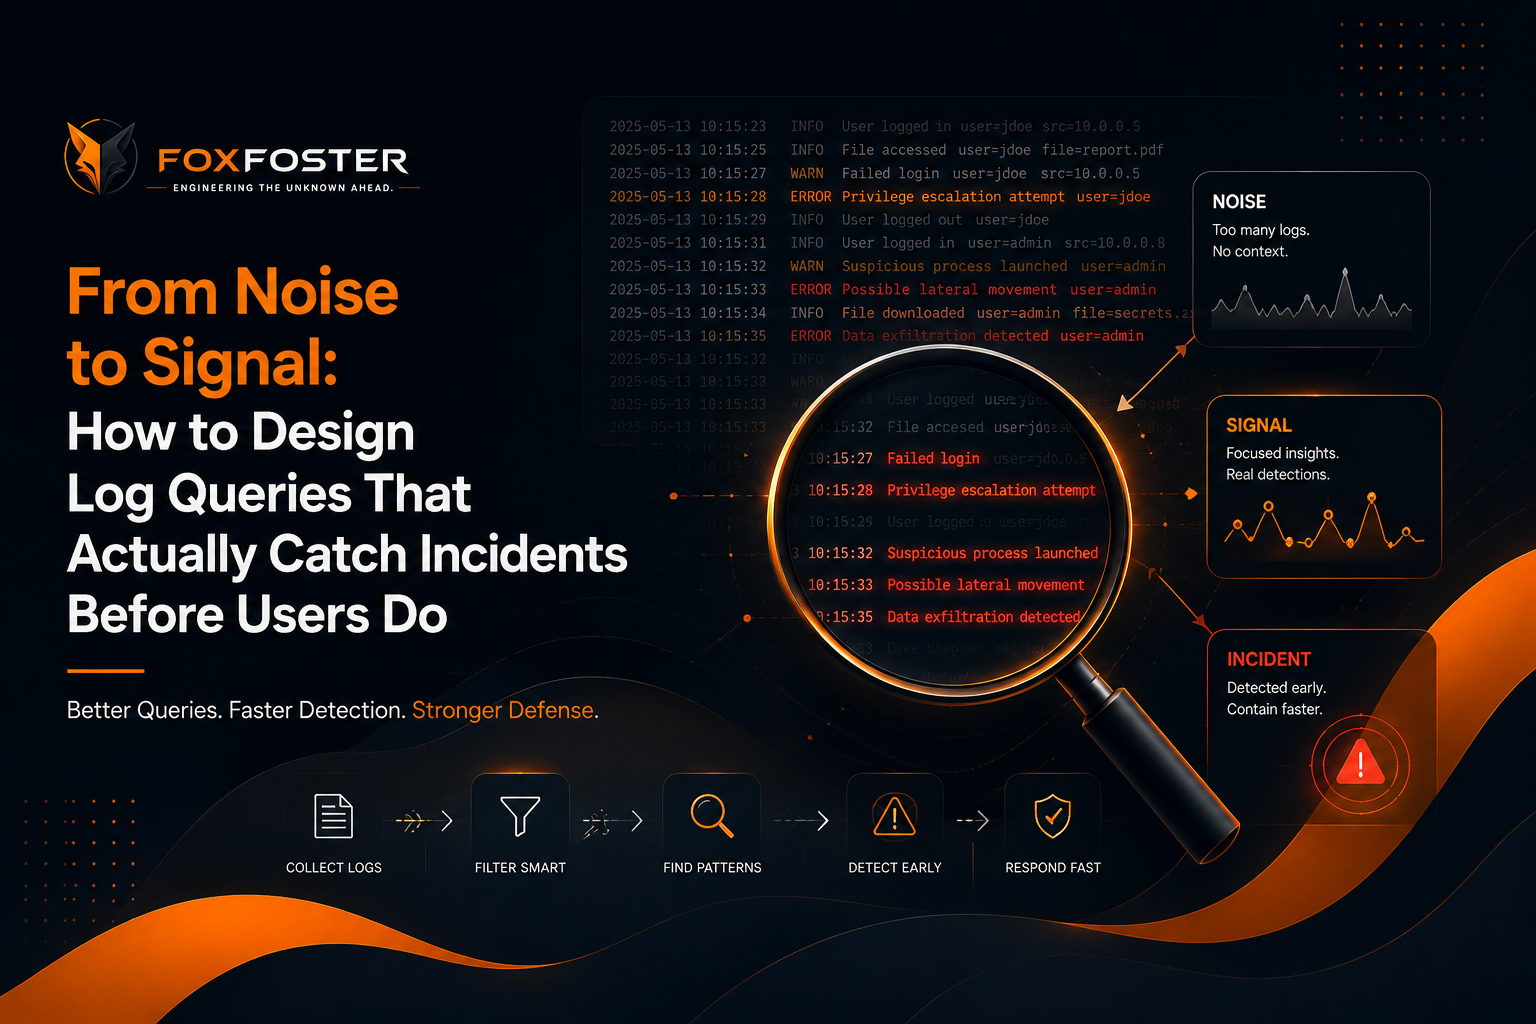
There's a moment every engineer dreads. A user tweets that your app is broken. You check your dashboards. Everything is green. You dig into your logs. Buried under 40,000 lines of "user logged in" and "cache hit," you find the actual error, three hours old.
Your logs knew. They just couldn't tell you.
This post is about fixing that. If you're new to log analysis, this is the mindset shift that separates people who watch logs from people who catch problems with them.
Why Bother With Log Queries at All?
Imagine a security guard on night patrol in a large office complex. She doesn't just stand at the front door; she walks the corridors and notices what's changed since yesterday — a door that should be locked but isn't, a window left open, a light on where nobody should be. Log queries do the same thing for a running software system. They walk the corridors of your service, hour by hour, and surface what has changed.
Every service you run is constantly writing tiny notes about what it just did. "Got a request." "Talked to the database." "Sent an email." "Something went wrong." These notes are logs. Individually they're boring. Collectively, they're the most detailed record of your system's behavior you'll ever have.
Log analysis is the practice of asking questions of that record. A log query is how you ask. It might be a simple text search (grep "ERROR") or a structured query in a tool like Elasticsearch, Datadog, Loki, or Splunk. The tool matters less than the thinking behind it.
A developer writes them to debug a failing feature after the fact. An on-call engineer writes them to catch an incident while it is still unfolding. The technique is the same; the goal and the urgency are different.
It is one of the first practical skills anyone picks up in a modern engineering role, long before they touch anything glamorous like distributed tracing or chaos engineering. Almost every incident review, every postmortem, and every performance investigation begins the same way — by asking the logs a well-shaped question.
The Core Problem: Noise vs. Signal
Most systems produce enormous volumes of logs. A modest web app can easily emit millions of lines a day. The vast majority are routine — successful requests, health checks, background jobs. This is noise.
Buried inside is signal — the small handful of events that indicate something is actually wrong, or about to be.
A beginner's instinct is to search for the word "error." This is a fine start and a terrible finish, for three reasons:
- Not all errors matter. Many are expected — a user typed a wrong password, a client cancelled a request.
- Not all incidents produce errors. A service can silently slow down, or a queue can silently stop processing, without ever logging the word "error."
- Volume changes everything. One error at 3 AM might be nothing. A hundred in a minute is an outage.
Good log queries aren't really about finding error messages. They're about detecting unusual patterns fast enough to act on them.
Four Principles That Turn Noise Into Signal
Most well-designed queries, however complex the tool, boil down to the same four ideas.
1. Start from user impact, not error text
Before you write a query, ask: "What would a user notice if this went wrong?"
- Checkout is broken → users can't complete a purchase.
- Login is broken → authentication requests are failing.
- The app is slow → response times are climbing.
Now translate that into a log query. Instead of searching for "NullPointerException" (which may or may not affect users), search for something like:
service:checkout status:500 endpoint:/api/orders
You're measuring the thing users feel, not the thing developers happen to log.
2. Count rates, not single events
A single failed request is almost never an incident. A sudden spike is.
New learners often build queries that fire on any occurrence of a keyword. This creates alert fatigue — dozens of notifications a day, none of which matter, until the one that does gets ignored.
Better: query for a rate or ratio.
- "More than 50 500-errors per minute from the checkout service."
- "Error rate above 2% of total requests, sustained for 5 minutes."
- "Zero successful logins in the last 3 minutes, when we normally see hundreds."
That last one is powerful. The absence of expected activity is often a stronger signal than the presence of errors. If your payment service usually processes 200 transactions a minute and suddenly processes zero, something is wrong even if no error was ever logged.
3. Establish a baseline before you alert
You cannot know what's abnormal without knowing what's normal.
Spend an afternoon just looking. Pick your most important service. Chart its logs over a week. What does a normal Tuesday morning look like? A Sunday night? When does traffic peak? What's the usual error rate — 0.1%? 0.5%? A steady 1%?
Once you know the shape of normal, deviations become obvious. Your queries can then be phrased as "significantly different from baseline" rather than fixed thresholds that need constant tuning.
4. Correlate across services
Modern applications are made of many small pieces talking to each other. An incident rarely lives in one service's logs.
A useful pattern: when service A starts failing, check if service B changed behavior just before.
Example: your API is throwing timeouts. Instead of just looking at API logs, query the database logs for the same time window. Slow queries? Connection pool exhausted? Now you've moved from symptom to cause.
Learning to write queries that span services is what turns you from someone who finds problems into someone who diagnoses them.
A Worked Example
Say you run a small e-commerce site. You want to catch checkout failures before Twitter does.
A beginner-level query:
"error" AND "checkout"
This will match harmless things (a validation error where a user forgot a field) and miss real ones (a payment gateway silently returning empty responses). It gives no sense of scale, no sense of user impact, and no comparison against a baseline.
A better-designed query, built with the four principles:
service:checkout
AND (status:>=500 OR event:payment_timeout OR event:gateway_no_response)
AND @timestamp:[now-5m TO now]
| stats count() by endpoint
| where count > baseline_avg * 3
In plain English: "In the checkout service, count events that indicate real user-facing failure over the last 5 minutes, grouped by endpoint. Alert me when any endpoint is failing three times more than its normal rate."
You've moved from "did the word error appear" to "is a specific user-facing capability degrading faster than usual." That, in a single query, is the noise-to-signal transition.
Common Beginner Traps
- Alerting on every error. You'll stop reading the alerts within a week. Alert on rates, ratios, and sustained anomalies instead.
- Ignoring log levels.
DEBUGandINFOare for humans reading after the fact.WARNandERRORare for investigating.FATALorCRITICALmeans something crashed hard. Use these when you filter, but don't trust them blindly — developers label things inconsistently. - Not adding context to logs. Your queries are only as good as the logs themselves. Without a request ID, a user ID, or a service name, correlation is nearly impossible. Push for structured logs (JSON) early — your future self will thank you.
- Searching without a time window. "Show me all errors" on a system with a year of logs is meaningless. Always bound queries by time; "last 15 minutes" is a good default for incident work.
- Copy-pasting queries you don't understand. Grabbing a colleague's query is fine — reading it line by line afterwards is how you actually learn.
How to Actually Get Better at This
Log analysis is a craft. Reading about it helps; doing it is what makes it stick.
- Explore your own system. Pick one service. Spend an hour just running queries and seeing what comes back. What surprises you?
- Practice on incidents that already happened. After any outage, go back to the logs. Could you have caught it earlier? What query would have fired first?
- Read other people's dashboards. Ask a senior engineer to walk you through theirs. The queries they've refined over years contain enormous amounts of implicit wisdom.
- Write down your queries. Keep a personal library. Over time you'll notice patterns and start composing new queries from old pieces.
The Mindset Shift
The goal isn't to look at logs. The goal is to have logs tell you things you didn't already know, before anyone else notices.
Every good log query is really a hypothesis: "If X is going wrong, this pattern will appear." When the pattern appears, you investigate. When it doesn't, you refine the hypothesis.
Do this consistently, and you'll stop finding out about outages from users. That's the whole game.
Key Points
- Log analysis is about separating noise from signal, not just searching for the word "error."
- A good query starts from user impact, measures rates instead of single events, compares against a baseline, and correlates across services.
- The absence of expected activity is often a stronger signal than the presence of errors.
- Structured logs with request IDs, user IDs, and service names are what make useful queries possible.
- Every query is a hypothesis. Refine it after every incident.
Further Reading: Google SRE Book (sre.google/books), Charity Majors "Observability: A Manifesto" (honeycomb.io/blog), Elastic Observability Documentation, Grafana Loki Best Practices.